Note
Go to the end to download the full example code.
Cross-phase modulation in the deep ultraviolet#
A strong pulse modulates the refractive index seen by any other pulse that overlaps it. In the co-polarised, constant-susceptibility approximation used here, the Kerr index change seen by a weak probe is \(2 n_2 I_\text{pump}(t)\), twice the self-phase modulation coefficient, and a weak probe acquires a time-dependent phase that broadens its spectrum – cross-phase modulation (XPM). Because the two pulses travel at different group velocities they slide through each other, and the broadening a probe acquires depends on where it starts relative to the pump: a probe that is overtaken by the pump sees the whole of the pump’s intensity profile sweep across it, and its spectrum is broadened, and shifted, most.
This makes XPM a way to broaden and compress pulses at wavelengths where direct
self-phase modulation is impractical. Here a weak deep-ultraviolet seed at 267 nm
(40 fs, 200 uJ) is spectrally broadened by a strong near-infrared pump at 800 nm (42 fs,
1 mJ) in a 1 m capillary of 125 um core radius filled with neon at 1.5 bar. The pump is
launched 60 fs after the seed (t0=60e-15); the ultraviolet seed is slower, so
the pump catches it up and passes through it along the fibre.
What to look for. In time, the pump overtakes the seed within the first part of the fibre. The seed’s spectrum around 267 nm broadens far more than it would alone, with a pronounced asymmetry set by the direction of the walk-off; the pump itself is modified much less.
What is approximate. Only the fundamental mode is carried; photoionisation of neon is included but small at these intensities.
This is panel (d) of the survey of nonlinear processes in the review by Travers et al.; the scheme is described by Jiang et al., Optica 11, 291 (2024).
See pulses and relative timing for the two-pulse launch and A frequency-dependent electronic response for the limitations of using one electronic coefficient across widely separated colours.
The run#
import time

import matplotlib.pyplot as plt
import numpy as np

from solprop.driver import prop_capillary
from solprop.plotting import prop_2d, spec_1d, time_1d
from solprop.processing import get_spectral_density
from solprop.pulses import GaussianPulse

pump = GaussianPulse(wavelength=800e-9, fwhm=42e-15, energy=1e-3, t0=60e-15)
seed = GaussianPulse(wavelength=267e-9, fwhm=40e-15, energy=200e-6)

started = time.perf_counter()
run = prop_capillary(
    125e-6,
    1.0,
    "Ne",
    1.5,
    lambda0=800e-9,
    pulses=[pump, seed],
    trange=800e-15,
    wavelength_limits=(200e-9, 3e-6),
    n_save=301,
    progress="none",
)
Spectral and temporal evolution#
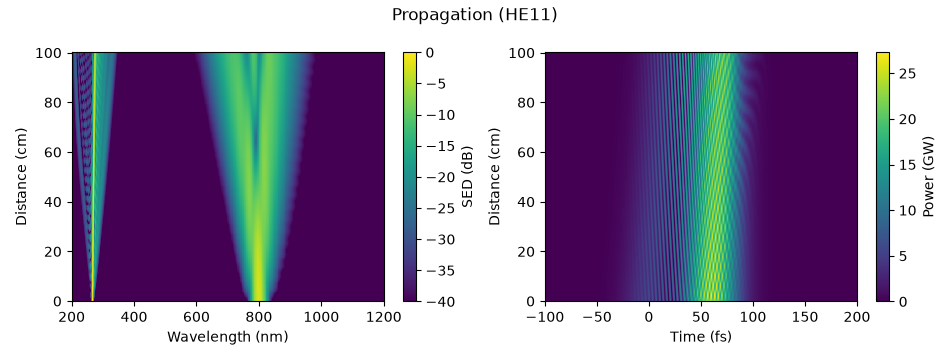
The seed’s spectrum#
The ultraviolet part of the spectrum at the entrance and the exit, and the pulses in time at both ends.
fig, (left, right) = plt.subplots(1, 2, figsize=(10.0, 3.6))
time_1d(run, z=[0.0, 1.0], trange=(-100e-15, 200e-15), ax=left)
spec_1d(run, z=[0.0, 1.0], ax=right, wavelength_range=(200e-9, 350e-9), log=False)
fig.tight_layout()


def rms_width(wavelength, density, band):
    """Return the rms spectral width of the density inside a wavelength band, m."""
    inside = (wavelength > band[0]) & (wavelength < band[1])
    weights = density[inside] / np.sum(density[inside])
    mean = np.sum(weights * wavelength[inside])
    return float(np.sqrt(np.sum(weights * (wavelength[inside] - mean) ** 2)))


band = (200e-9, 350e-9)
before = rms_width(*get_spectral_density(run, "wavelength", plane=0), band)
after = rms_width(*get_spectral_density(run, "wavelength", plane=-1), band)
print(
    f"rms width of the ultraviolet seed: {before * 1e9:.2f} nm at the entrance, "
    f"{after * 1e9:.2f} nm at the exit ({after / before:.1f} times)"
)
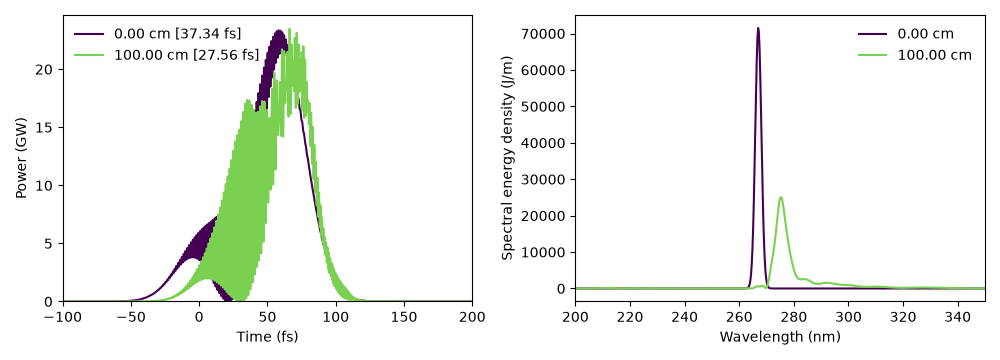
rms width of the ultraviolet seed: 1.11 nm at the entrance, 13.32 nm at the exit (12.0 times)
Runtime and reproducibility#
print(f"{time.perf_counter() - started:.0f} s; backend {run.metadata.backend.name}")
7 s; backend native
Total running time of the script: (0 minutes 6.540 seconds)