Note
Go to the end to download the full example code.
Raman soliton self-frequency shift in hydrogen#
In a Raman-active gas a soliton shifts its own spectrum to longer wavelengths. The blue edge of its spectrum pumps the red edge through stimulated Raman scattering – here from the rotational transitions of molecular hydrogen, whose coherence persists for tens to hundreds of picoseconds – so the soliton continuously transfers energy to longer wavelengths as it propagates: the soliton self-frequency shift (SSFS). Because the group velocity changes as the wavelength changes, the red-shifting soliton also decelerates and its trajectory in time bends. In solid-core fibres the same effect comes from the vibrational response of glass; in hydrogen the response is dominated by the rotational Raman lines and can be tuned with the gas pressure.
Here a 40 fs, 4 uJ pulse at 1030 nm travels 2 m through a 20 um-radius hollow fibre filled with hydrogen at 5 bar. The waveguide is modelled as a capillary with its loss switched off, which stands in for the low-loss antiresonant fibres such experiments use; photoionisation is off.
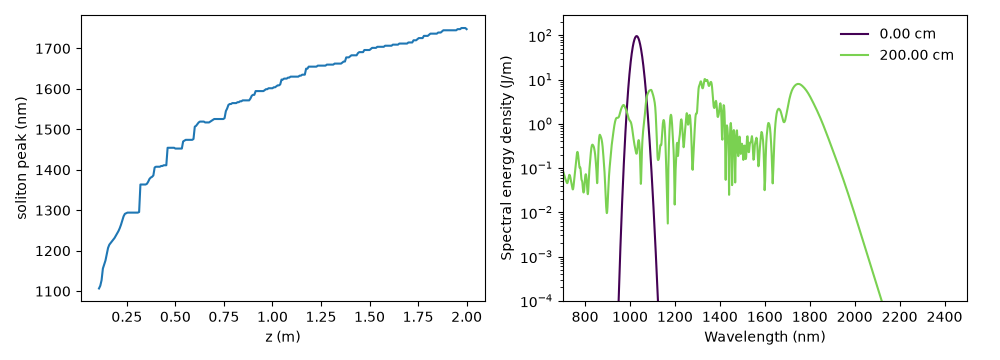
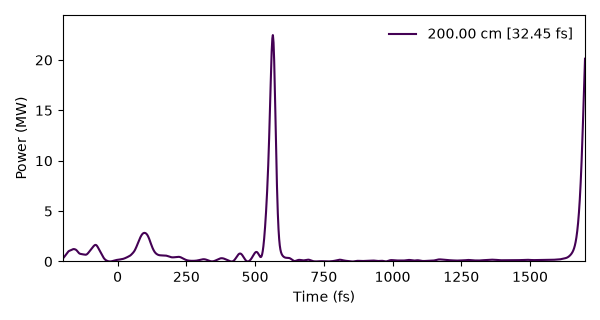
What to look for. After a short compression the soliton emerges and its spectrum moves steadily to the red, to about 1.75 um by the end of the fibre, while the pulse in time bends towards later arrival. The remaining pump radiation stays near 1030 nm, and at the exit a second, non-soliton feature near 1.33 um is the tallest on the red side of the spectrum (the soliton’s peak is about 0.84 of it); the shift is therefore followed as the longest-wavelength strong peak, not the tallest one.
What is approximate. The waveguide dispersion of a capillary is used for an antiresonant fibre, whose resonances are ignored; only the fundamental mode is carried. The Raman response is optmat’s line-by-line model of hydrogen, with its lines grouped by width into three damping groups; 5 bar is 4.6 amagat, inside the model’s validated range. With solprop’s former built-in Raman and Kerr data (before SEP 3) the soliton reached about 1.74 um, and the 1.33 um feature stayed below it.
This is panel (e) of the survey of nonlinear processes in the review by Travers et al.; the experiment it is based on is reported by Lippl et al., Optics Letters 51 (2026).
The Raman guide explains the delayed response, line widths and time-window requirements. Compare the blue-shifting mechanism in Photoionisation-induced soliton blue-shift.
The run#
Molecular hydrogen carries its rotational and vibrational Raman response by default.
import time

import matplotlib.pyplot as plt
import numpy as np
from scipy.signal import find_peaks

from solprop.driver import prop_capillary
from solprop.plotting import prop_2d, spec_1d, time_1d
from solprop.processing import get_spectral_density

started = time.perf_counter()
run = prop_capillary(
    20e-6,
    2.0,
    "H2",
    5.0,
    lambda0=1030e-9,
    fwhm=40e-15,
    energy=4e-6,
    loss=False,
    plasma=False,
    trange=3.5e-12,
    wavelength_limits=(400e-9, 4e-6),
    n_save=301,
    progress="none",
)
Spectral and temporal evolution#
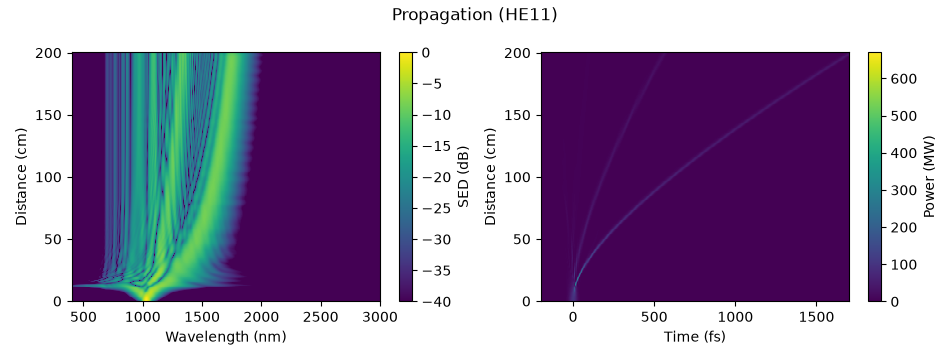
The shift#
The soliton’s wavelength along the fibre: on the red side of the pump, the longest-wavelength spectral peak that reaches at least 30 % of the red side’s maximum (with a prominence of 10 % of it). The tallest red-side peak is not the soliton at the exit: a cluster near 1.33 um outgrows it there.
z = np.asarray(run["z"])
wavelength, density = get_spectral_density(run, "wavelength")
red = wavelength > 1.08e-6


def soliton_wavelength(spectrum):
    """Return the longest red-side wavelength of a strong spectral peak, or NaN."""
    tallest = spectrum.max()
    peaks, _ = find_peaks(spectrum, height=0.3 * tallest, prominence=0.1 * tallest)
    return wavelength[red][peaks].max() if peaks.size else np.nan


peak = np.array([soliton_wavelength(spectrum) for spectrum in density[:, red]])
tallest = wavelength[red][np.argmax(density[-1, red])]

fig, (left, right) = plt.subplots(1, 2, figsize=(10.0, 3.6))
left.plot(z, peak * 1e9)
left.set_xlabel("z (m)")
left.set_ylabel("soliton peak (nm)")
spec_1d(run, z=[0.0, 2.0], ax=right, wavelength_range=(700e-9, 2.5e-6))
fig.tight_layout()
print(
    f"soliton peak at the exit: {peak[-1] * 1e9:.0f} nm; "
    f"tallest red-side peak: {tallest * 1e9:.0f} nm"
)

fig, ax = plt.subplots(figsize=(6.0, 3.2))
time_1d(run, z=2.0, trange=(-200e-15, 1.7e-12), ax=ax)
fig.tight_layout()
soliton peak at the exit: 1748 nm; tallest red-side peak: 1334 nm
Runtime and reproducibility#
print(f"{time.perf_counter() - started:.0f} s; backend {run.metadata.backend.name}")
167 s; backend native
Total running time of the script: (2 minutes 47.334 seconds)